
Graph#
#class relationalai.std.graphs.Graph(
    model: Model,
    undirected: bool = False,
    weighted: bool = False,
    default_weight: float = 1.0
)
Use the Graph class to Create graphs representing relationships between objects
in a model and perform graph reasoning.
RelationalAI supports directed and undirected graphs, as well as edge-weighted graphs.
Multigraphs are currently not supported. This means that if you have multiple edges between
two nodes, you may need to preprocess them in advance.
Parameters#
| Name | Type | Description |
|---|---|---|
model | Model | The model on which the Graph is instantiated. |
undirected | bool | Whether the graph is undirected. Default is False. |
weighted | bool | Whether the graph is weighted. Default is False. |
default_weight | float | The default weight for edges in the graph. Default is 1.0. Ignored if weighted is set to False. |
Attributes#
| Name | Type | Description |
|---|---|---|
.id | int | The unique system ID of the graph. |
.model | Model | The model on which the graph is based. |
.undirected | bool | Whether the graph is undirected. Read-only. |
.weighted | bool | Whether the graph is weighted. Read-only. |
.Node | Type | A type containing the graph’s nodes. |
.Edge | Edge | A type-like object containing the graph’s edges. |
.compute | Compute | A namespace for graph reasoning methods. |
Methods#
| Name | Description | Returns |
|---|---|---|
.fetch() | Get a dictionary representation of the graph. | dict |
.visualize(style, **kwargs) | Visualize the graph. | A gravis Figure object. |
Example#
Use the Graph() constructor to create a new graph object and add nodes and edges
using the graph.Node and graph.Edge objects.
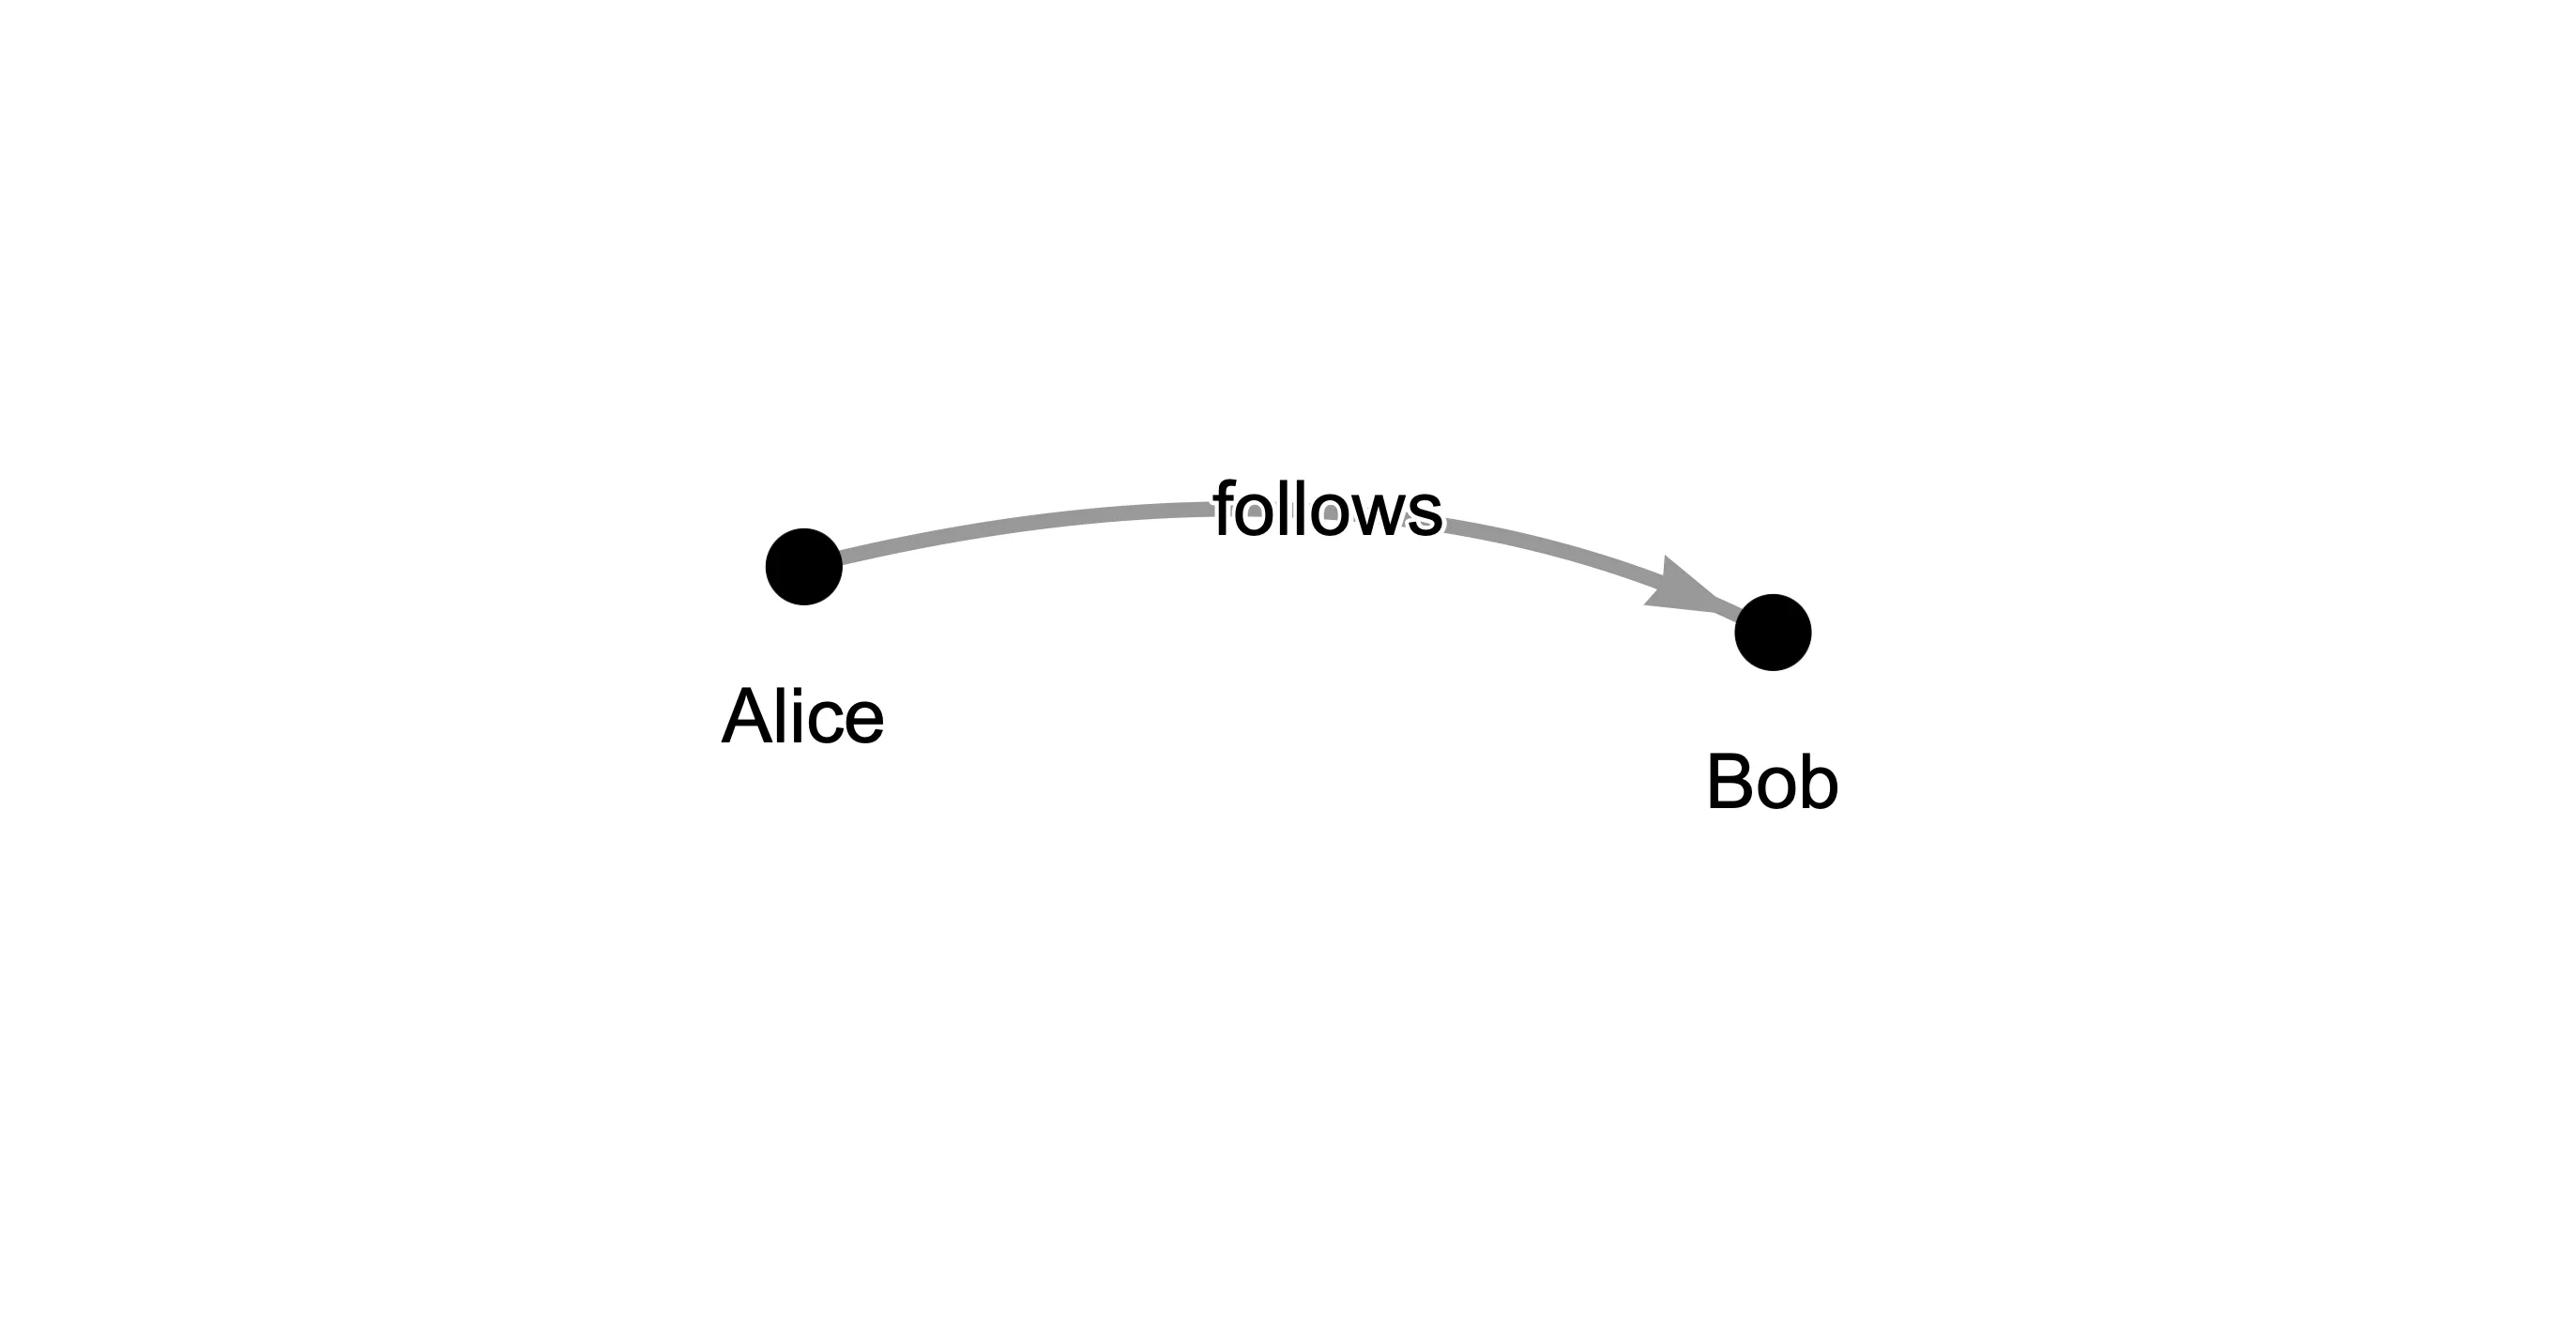
This example creates a directed graph from a basic social network model and visualizes it with node and edge labels:
#import relationalai as rai
from relationalai.std.graphs import Graph

# Create a model with a `Person` type.
model = rai.Model("socialNetwork")
Person = model.Type("Person")

# Add people to the model connected by a multi-valued `follows` property.
with model.rule():
    alice = Person.add(name="Alice")
    bob = Person.add(name="Bob")
    alice.follows.add(bob)

# Create a graph. By default, graphs are directed and unweighted.
graph = Graph(model)

# Add all 'Person' objects to the graph as nodes, labeling them by their
# 'name' property. Node and edge labels are optional and are shown in visualizations.
graph.Node.extend(Person, label=Person.name)

# Add edges using the 'Person.follows' property to connect nodes.
graph.Edge.extend(Person.follows, label="follows")

# Visualize the graph. In Jupyter notebooks, '.display()' is not needed.
graph.visualize().display()
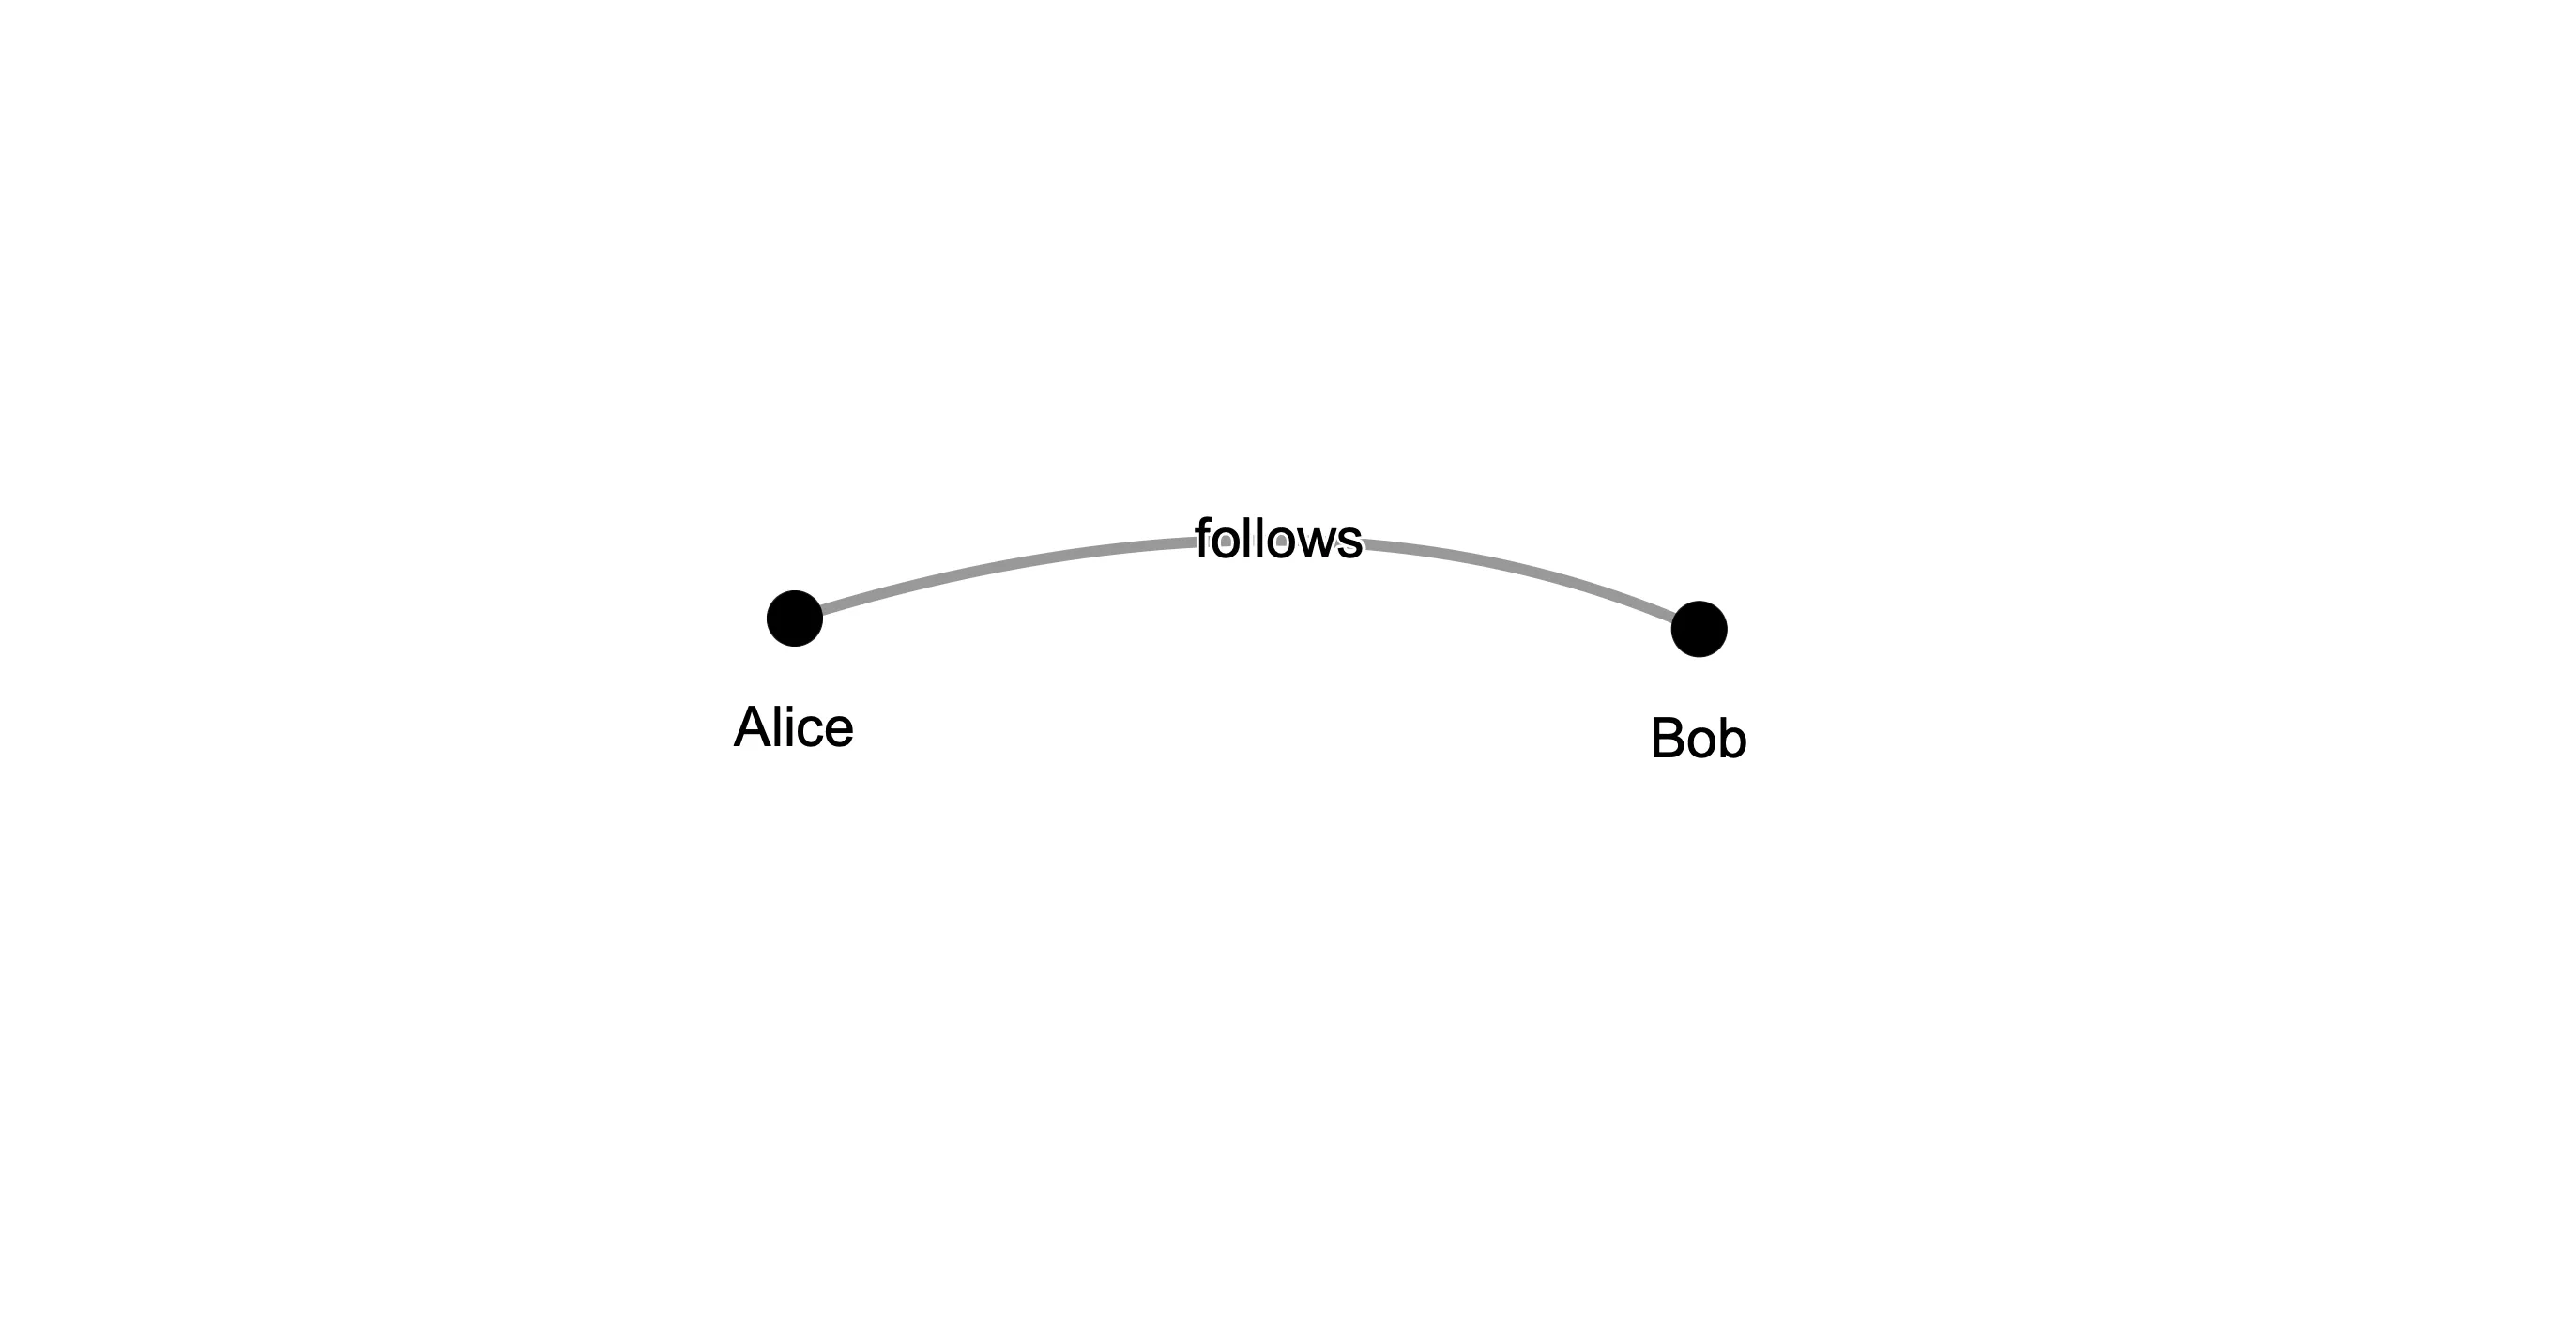
Set the undirected parameter to True to create an undirected graph.
In visualizations, undirected edges are drawn as lines without arrows:
#graph = Graph(model, undirected=True)
graph.Node.extend(Person, label=Person.name)
graph.Edge.extend(Person.follows, label="follows")
graph.visualize().display()
To create a weighted graph, set the weighted parameter to True.
In a weighted graph, edges have a weight property that can be used in graph algorithms.
The default_weight parameter, which defaults to 1.0,
sets the default weight for any edges without a weight property.
Both directed and undirected graphs can be weighted.
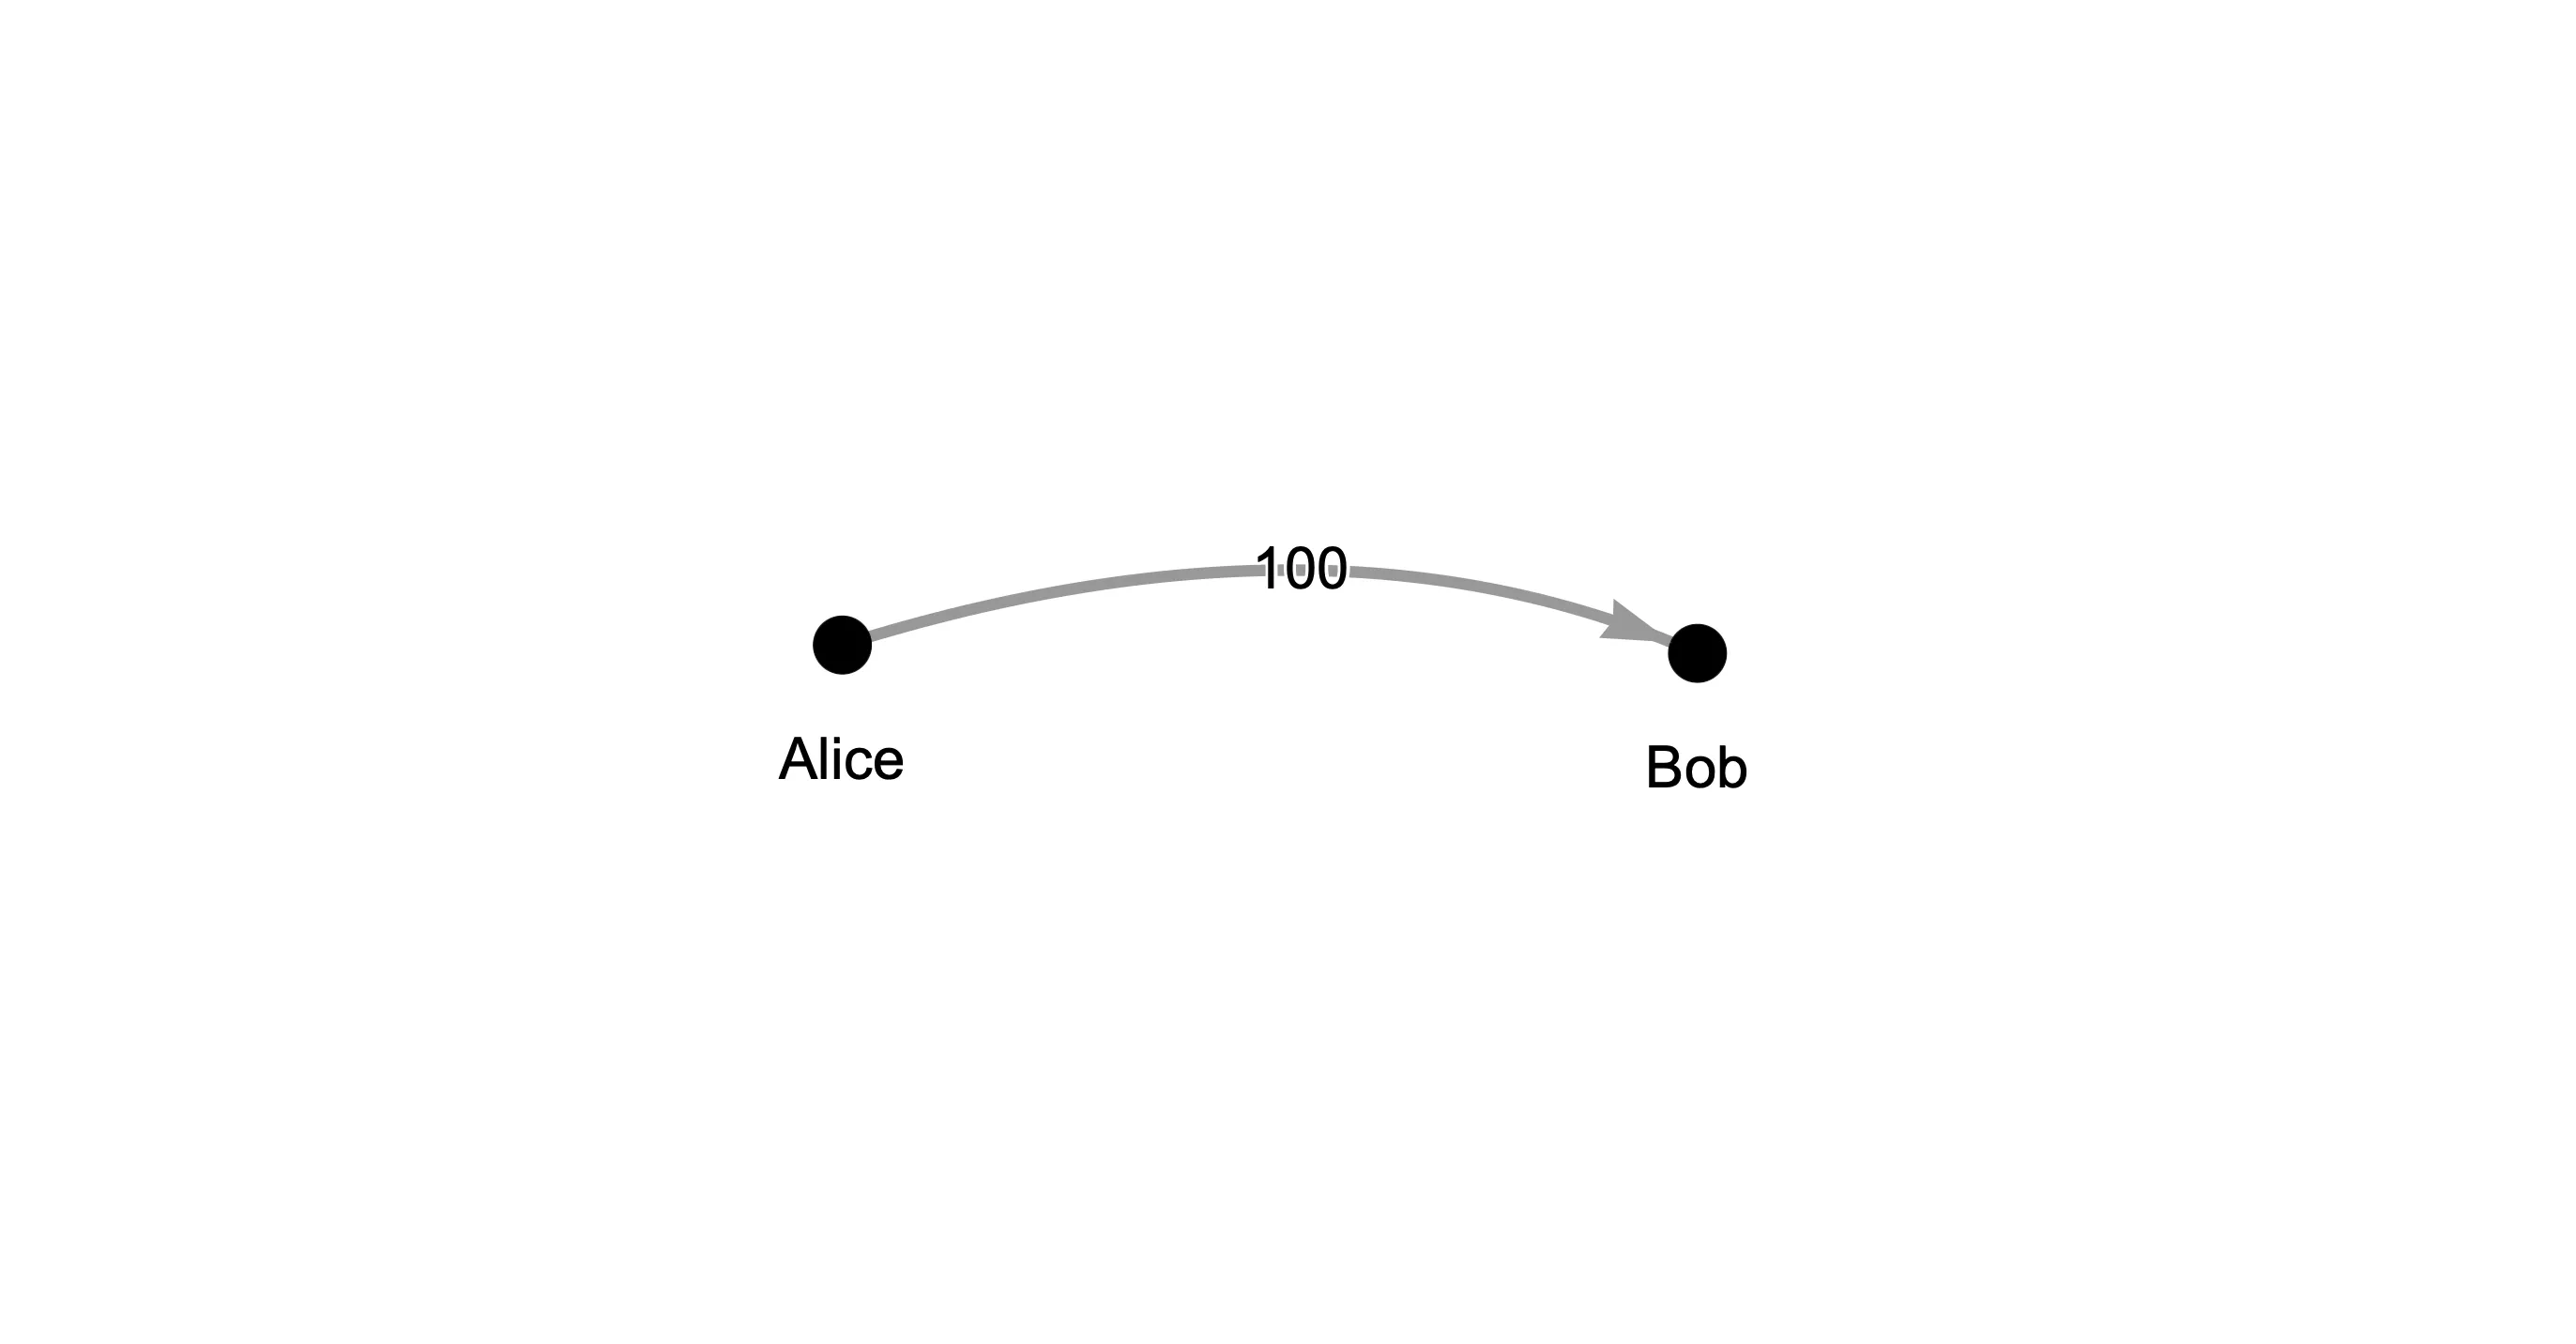
In the next example, we create a weighted, directed graph from a model of financial transactions between people:
#import relationalai as rai
from relationalai.std.graphs import Graph

# Create a model with 'Person' and 'Transaction' types.
model = rai.Model("transactions")
Person = model.Type("Person")
Transaction = model.Type("Transaction")

# Add some people and a transaction to the model.
with model.rule():
    alice = Person.add(name="Alice")
    bob = Person.add(name="Bob")
    transaction = Transaction.add(sender=alice, recipient=bob, amount=100.0)

# Create a weighted, directed graph.
graph = Graph(model, weighted=True)

# Add all 'Person' objects to the graph as nodes, labeling them by their 'name' property.
graph.Node.extend(Person, label=Person.name)

# Add edges to the graph from the 'Transaction' type.
# The edge weights are set to the transaction's 'amount' property.
with model.rule():
    t = Transaction()
    graph.Edge.add(t.sender, t.recipient, weight=t.amount)

# Visualize the graph with edges labeled by their weight.
# Use a lambda function to access the weight of each edge,
# since no label property is set. Note that properties are
# accessed using subscript notation instead of dot notation.
graph.visualize(style={"edge": {"label": lambda e: e['weight']}}).display()
Graphs are visualized using the gravis package.
See .visualize() for more examples of customizing graph visualizations.
Use the .compute property to access graph reasoning methods,
such as computing the PageRank of nodes in the graph:
#with model.query() as select:
    person = Person()
    pagerank = graph.compute.pagerank(person)
    response = select(person.name, pagerank)

print(response.results)
# Output:
#     name         v
# 0  Alice  0.350877
# 1    Bob  0.649123
See the Compute class for a list of available graph reasoning methods.