
Graph.visualize()#
relationalai.std.graphs
#Graph.visualize(three: bool = False, style: dict = {}, **kwargs) -> Figure
Visualize a graph.
Parameters#
| Name | Type | Description |
|---|---|---|
three | bool | Whether or not to use the three.js 3D render engine. Defaults to False. |
style | dict | A dictionary of visual properties for nodes and edges. |
**kwargs | Any | Additional keyword arguments to pass to the gravis visualization library. See the gravis docs for full details. |
Returns#
A gravis Figure object.
Example#
#import relationalai as rai
from relationalai.std.graphs import Graph
# Create a model with a 'Person' type.
model = rai.Model("socialNetwork")
Person = model.Type("Person")
# Add people to the model connected by a multi-valued 'follows' property.
with model.rule():
alice = Person.add(name="Alice")
bob = Person.add(name="Bob")
alice.follows.add(bob)
# Create a graph with edges from the `Person.follows` property.
graph = Graph(model)
graph.Node.extend(Person)
graph.Edge.extend(Person.follows)
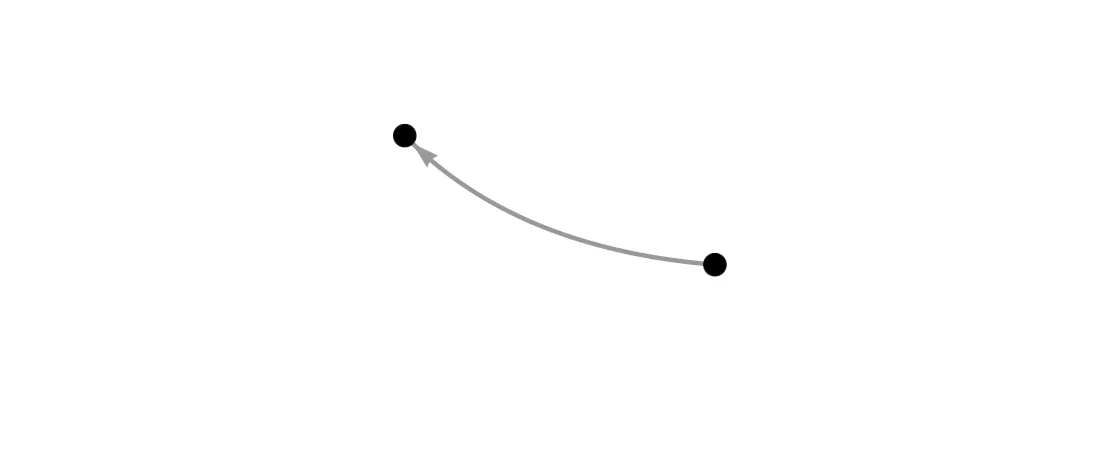
# Visualize the graph.
fig = graph.visualize()
# To display the graph in a new browser tab.
fig.display()
# To display the graph inline in a Jupyter or Snowflake notebook.
fig.display(inline=True)
You may change the label, color, and size of nodes and edges:
#import relationalai as rai
from relationalai.std.graphs import Graph

# Create a model with 'Person' and 'Brand' types.
model = rai.Model("socialNetwork")
Person = model.Type("Person")
Brand = model.Type("Brand")

# Add some people to the model and connect them with a multi-valued `follows` property.
with model.rule():
    alice = Person.add(name="Alice")
    bob = Person.add(name="Bob")
    acme = Brand.add(name="Acme")
    alice.follows.extend([bob, acme])
    bob.follows.add(acme)

# Create a directed graph with 'Person' and 'Brand' nodes and 'follows' edges.
graph = Graph(model)
graph.Node.extend(Person, label=Person.name, color="blue")
graph.Node.extend(Brand, label=Brand.name, color="red")
graph.Edge.extend(Person.follows, label="follows")

# Compute the PageRank of people in the graph and use it for the node's size.
with model.rule():
    person = Person()
    rank = graph.compute.pagerank(person)
    graph.Node.add(person, size=rank * 50)

# Visualize the graph.
fig = graph.visualize()

# Display the graph in a new browser tab.
fig.display()

# Display the graph inline in a Jupyter or Snowflake notebook.
fig.display(inline=True)
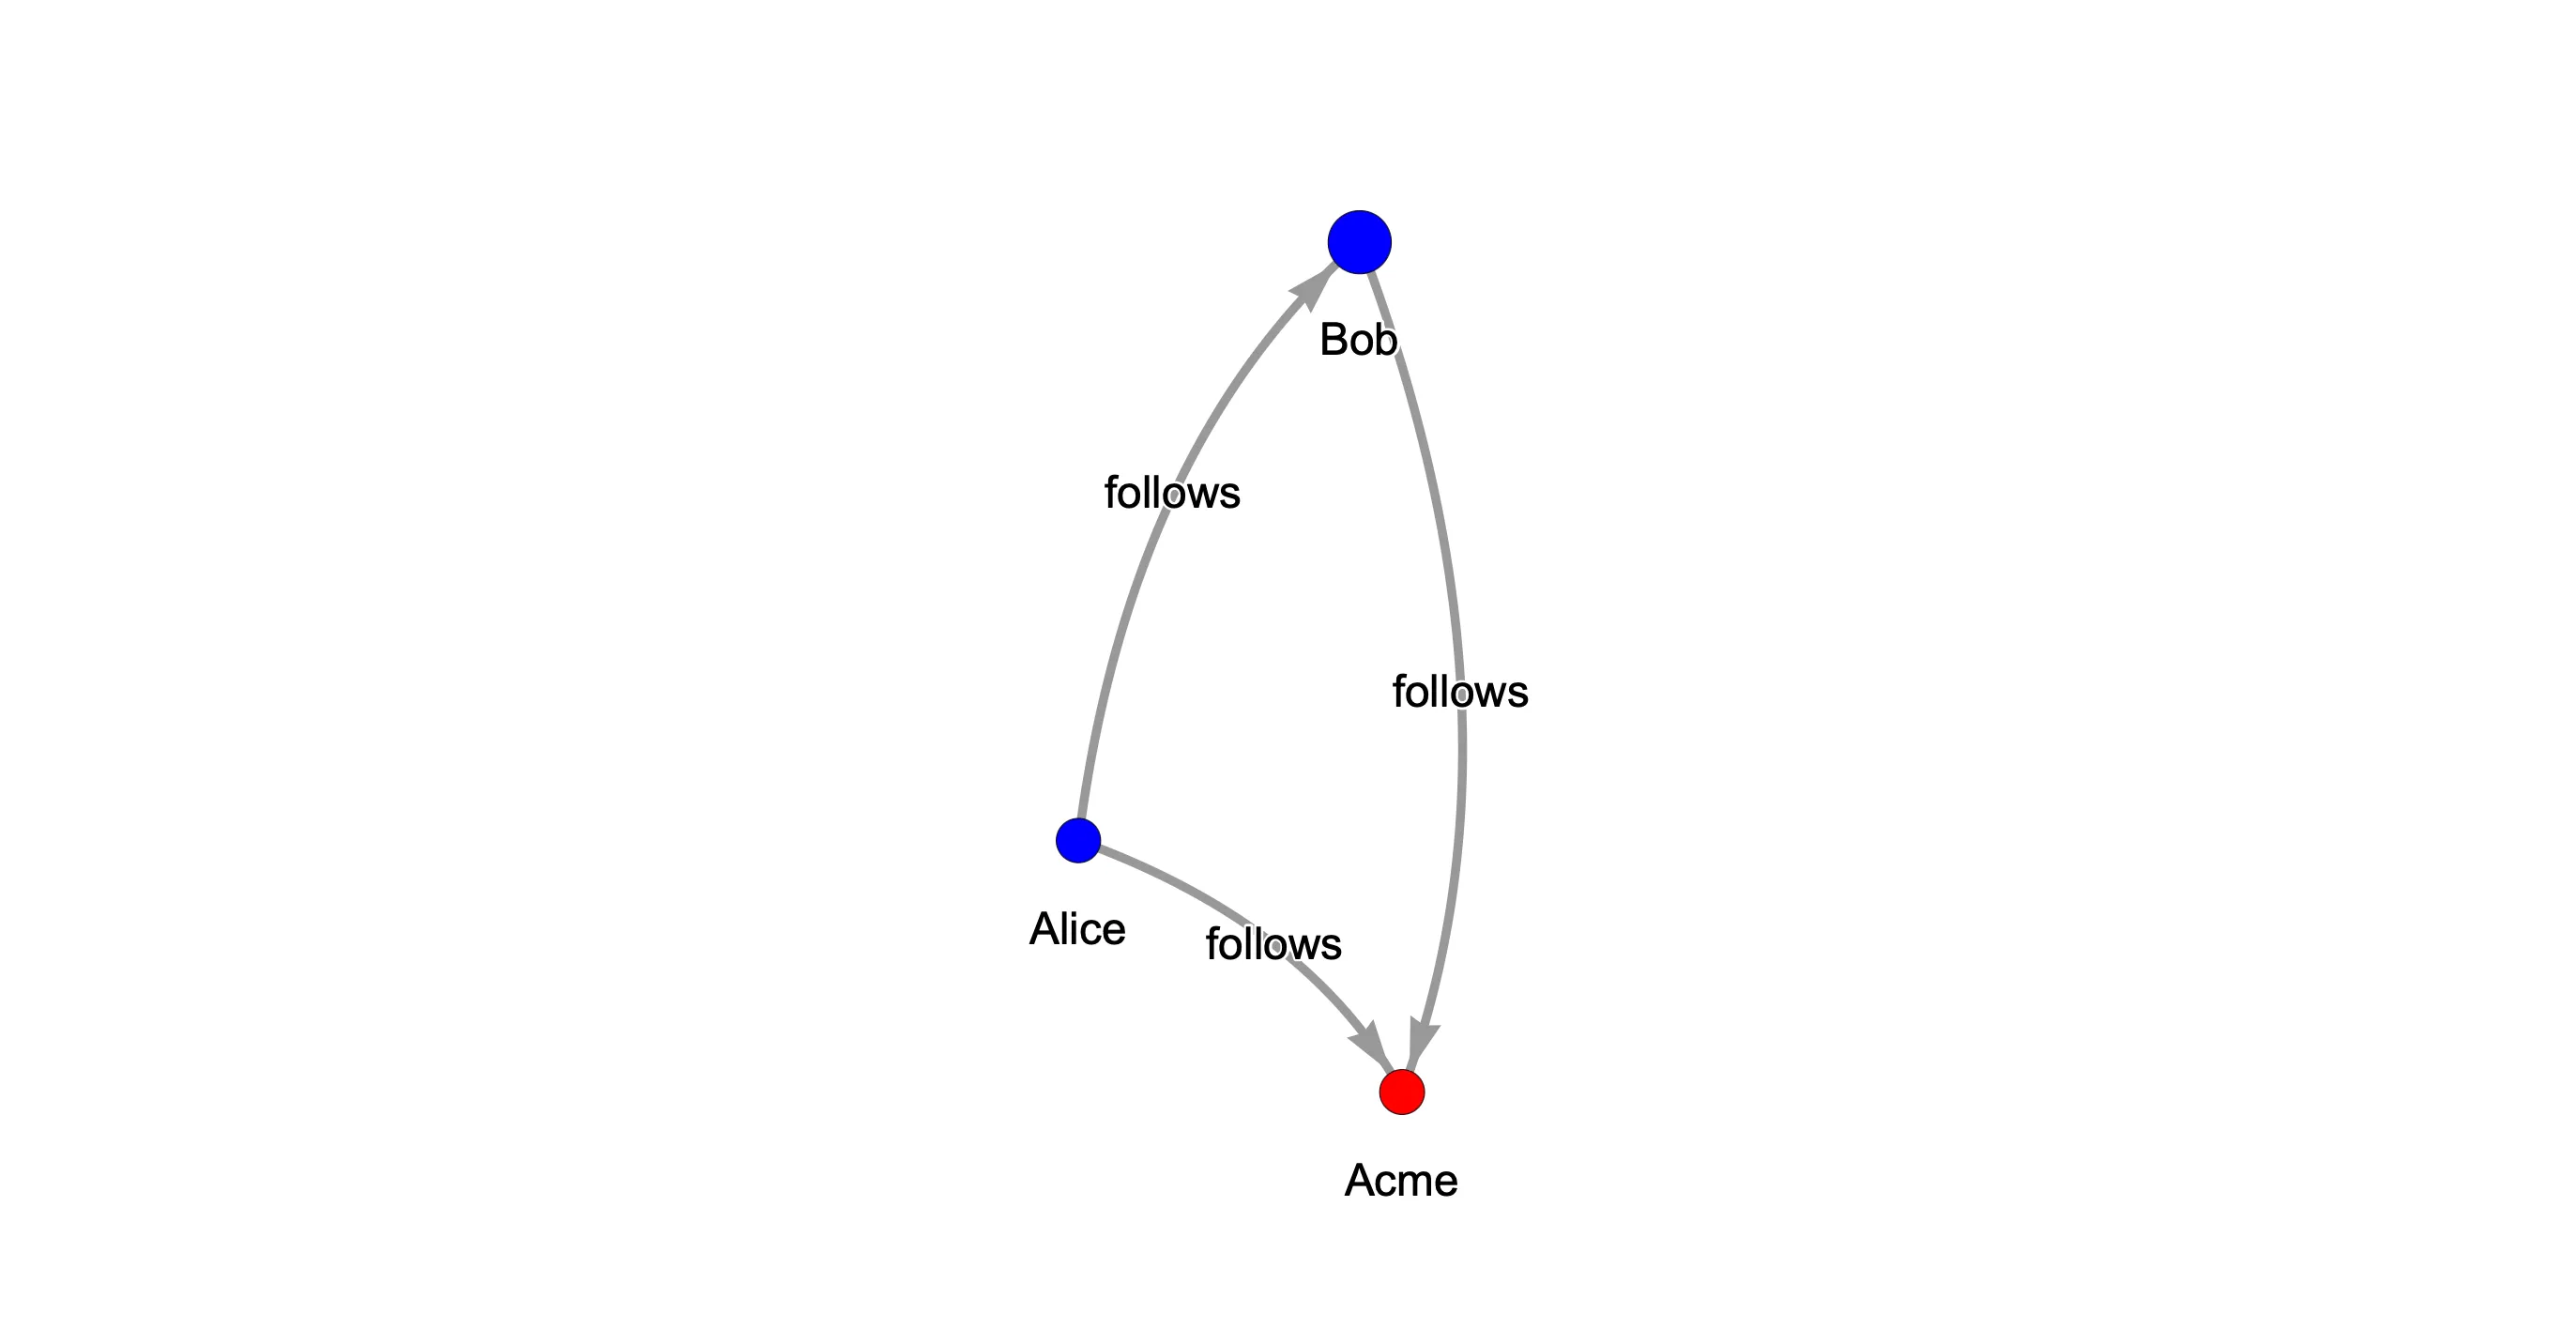
You can also describe the visual properties of nodes and edges by passing a dictionary to the style parameter.
The following example produces the same visualization as the preceding example:
#import relationalai as rai
from relationalai.std.graphs import Graph

model = rai.Model("socialNetwork")
Person = model.Type("Person")
Brand = model.Type("Brand")

with model.rule():
    alice = Person.add(name="Alice")
    bob = Person.add(name="Bob")
    acme = Brand.add(name="Acme")
    alice.follows.extend([bob, acme])
    bob.follows.add(acme)

graph = Graph(model)
graph.Node.extend(Person, kind="person")
graph.Node.extend(Brand, kind="brand")
graph.Edge.extend(Person.follows)


with model.rule():
    person = Person()
    rank = graph.compute.pagerank(person)
    graph.Node.add(person)

fig = graph.visualize(style={
    "nodes": {
        # Color nodes by their 'kind' property.
        "color": lambda n: {"person": "blue", "brand": "red"}.get(n["kind"]),
        # Size nodes by their 'rank' property and scale them.
        "size": lambda n: n.get("rank", 1.0) * 50,
    },
    # Label edges as "follows."
    "edges": {"label": "follows"}
})

# Display the graph in a new browser tab.
fig.display()

# Display the graph inline in a Jupyter or Snowflake notebook.
fig.display(inline=True)