
Knowledge Graphs for Earthquake Data
Earthquakes are irregular and devastating natural hazards that affect many regions of the world. Seismology is the scientific, data-driven study of earthquakes.
The field aims to record earthquakes with seismometers and assemble catalogs of past earthquakes, quantifying their spatial distribution, temporal occurrence, and magnitude. With this information, it is possible to forecast the likelihood of future earthquakes, assess hazards, and inform impactful decisions.
However, there are some frustrations when working with seismic data. Firstly, there are many competing data formats used by different institutions. These different standards make it difficult to combine multiple sources of information.
Furthermore, many tools for handling seismic data use imperative languages, only supporting simple queries. Despite these difficulties, the information conveyed by seismic data tends to be well structured and hierarchical.
These frustrations and opportunities motivate a fresh, modern approach to seismic data, with a relational knowledge graph framework and RelationalAI's declarative querying language, Rel.
Relational Knowledge Graphs
To approach this problem, I used Rel to construct relational knowledge graphs for two types of seismic data:
Seismometer metadata, and Earthquake data.
Seismometer metadata contains information like the geographic locations of seismometers, and their temporal operational extents. On the other hand, earthquake data (or catalogs) record the locations and points in time where earthquakes have happened.
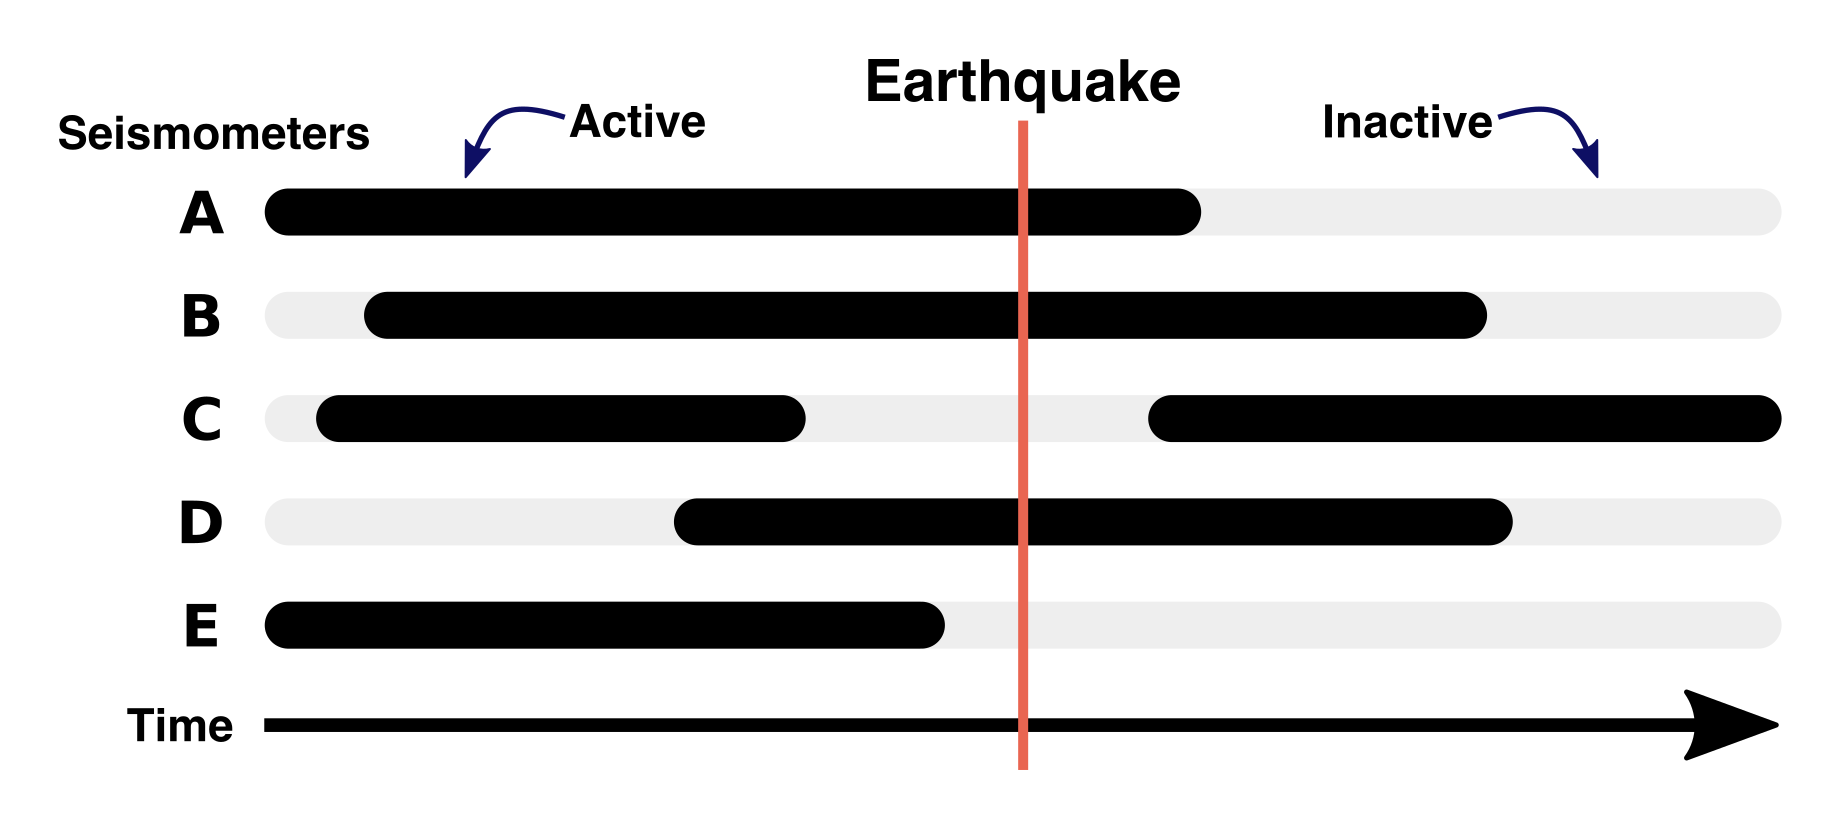
An element of particular interest is the intersection of these two concepts. If a seismometer is operational during an earthquake, it will record the variations in ground motion. This data is valuable for assessing future hazards, and hence is of great scientific interest.
To explore both seismometer and earthquake data, two knowledge graphs can be constructed, with the aim of querying either one, or both, to obtain useful information.
Seismic Station Metadata
Seismometer metadata conveys information about the instrument’s position, start and end times, and their organizational structure. An example snippet of this metadata is shown below (collected from IRIS as “stationXML” files, converted into JSON).
{
    "Network": [
    "@code": "AV",
    "Description": "Alaska Volcano Observatory",
    "Station": [
        {
            "@code": "AMKA",
            "Latitude": "51.378682",
            "Longitude": "179.301832",
            "Channel": [
            	{
                	"@code": "BHE",
                	"@locationCode": "00",
                	"@startDate": "2005-10-14T00:00:00.0000",
                	"@endDate": "2018-08-21T00:00:00.0000",
                	"SampleRate": "5E01",
         	       ... other attributes ...
The information is arranged hierarchically. The different types of entities include:
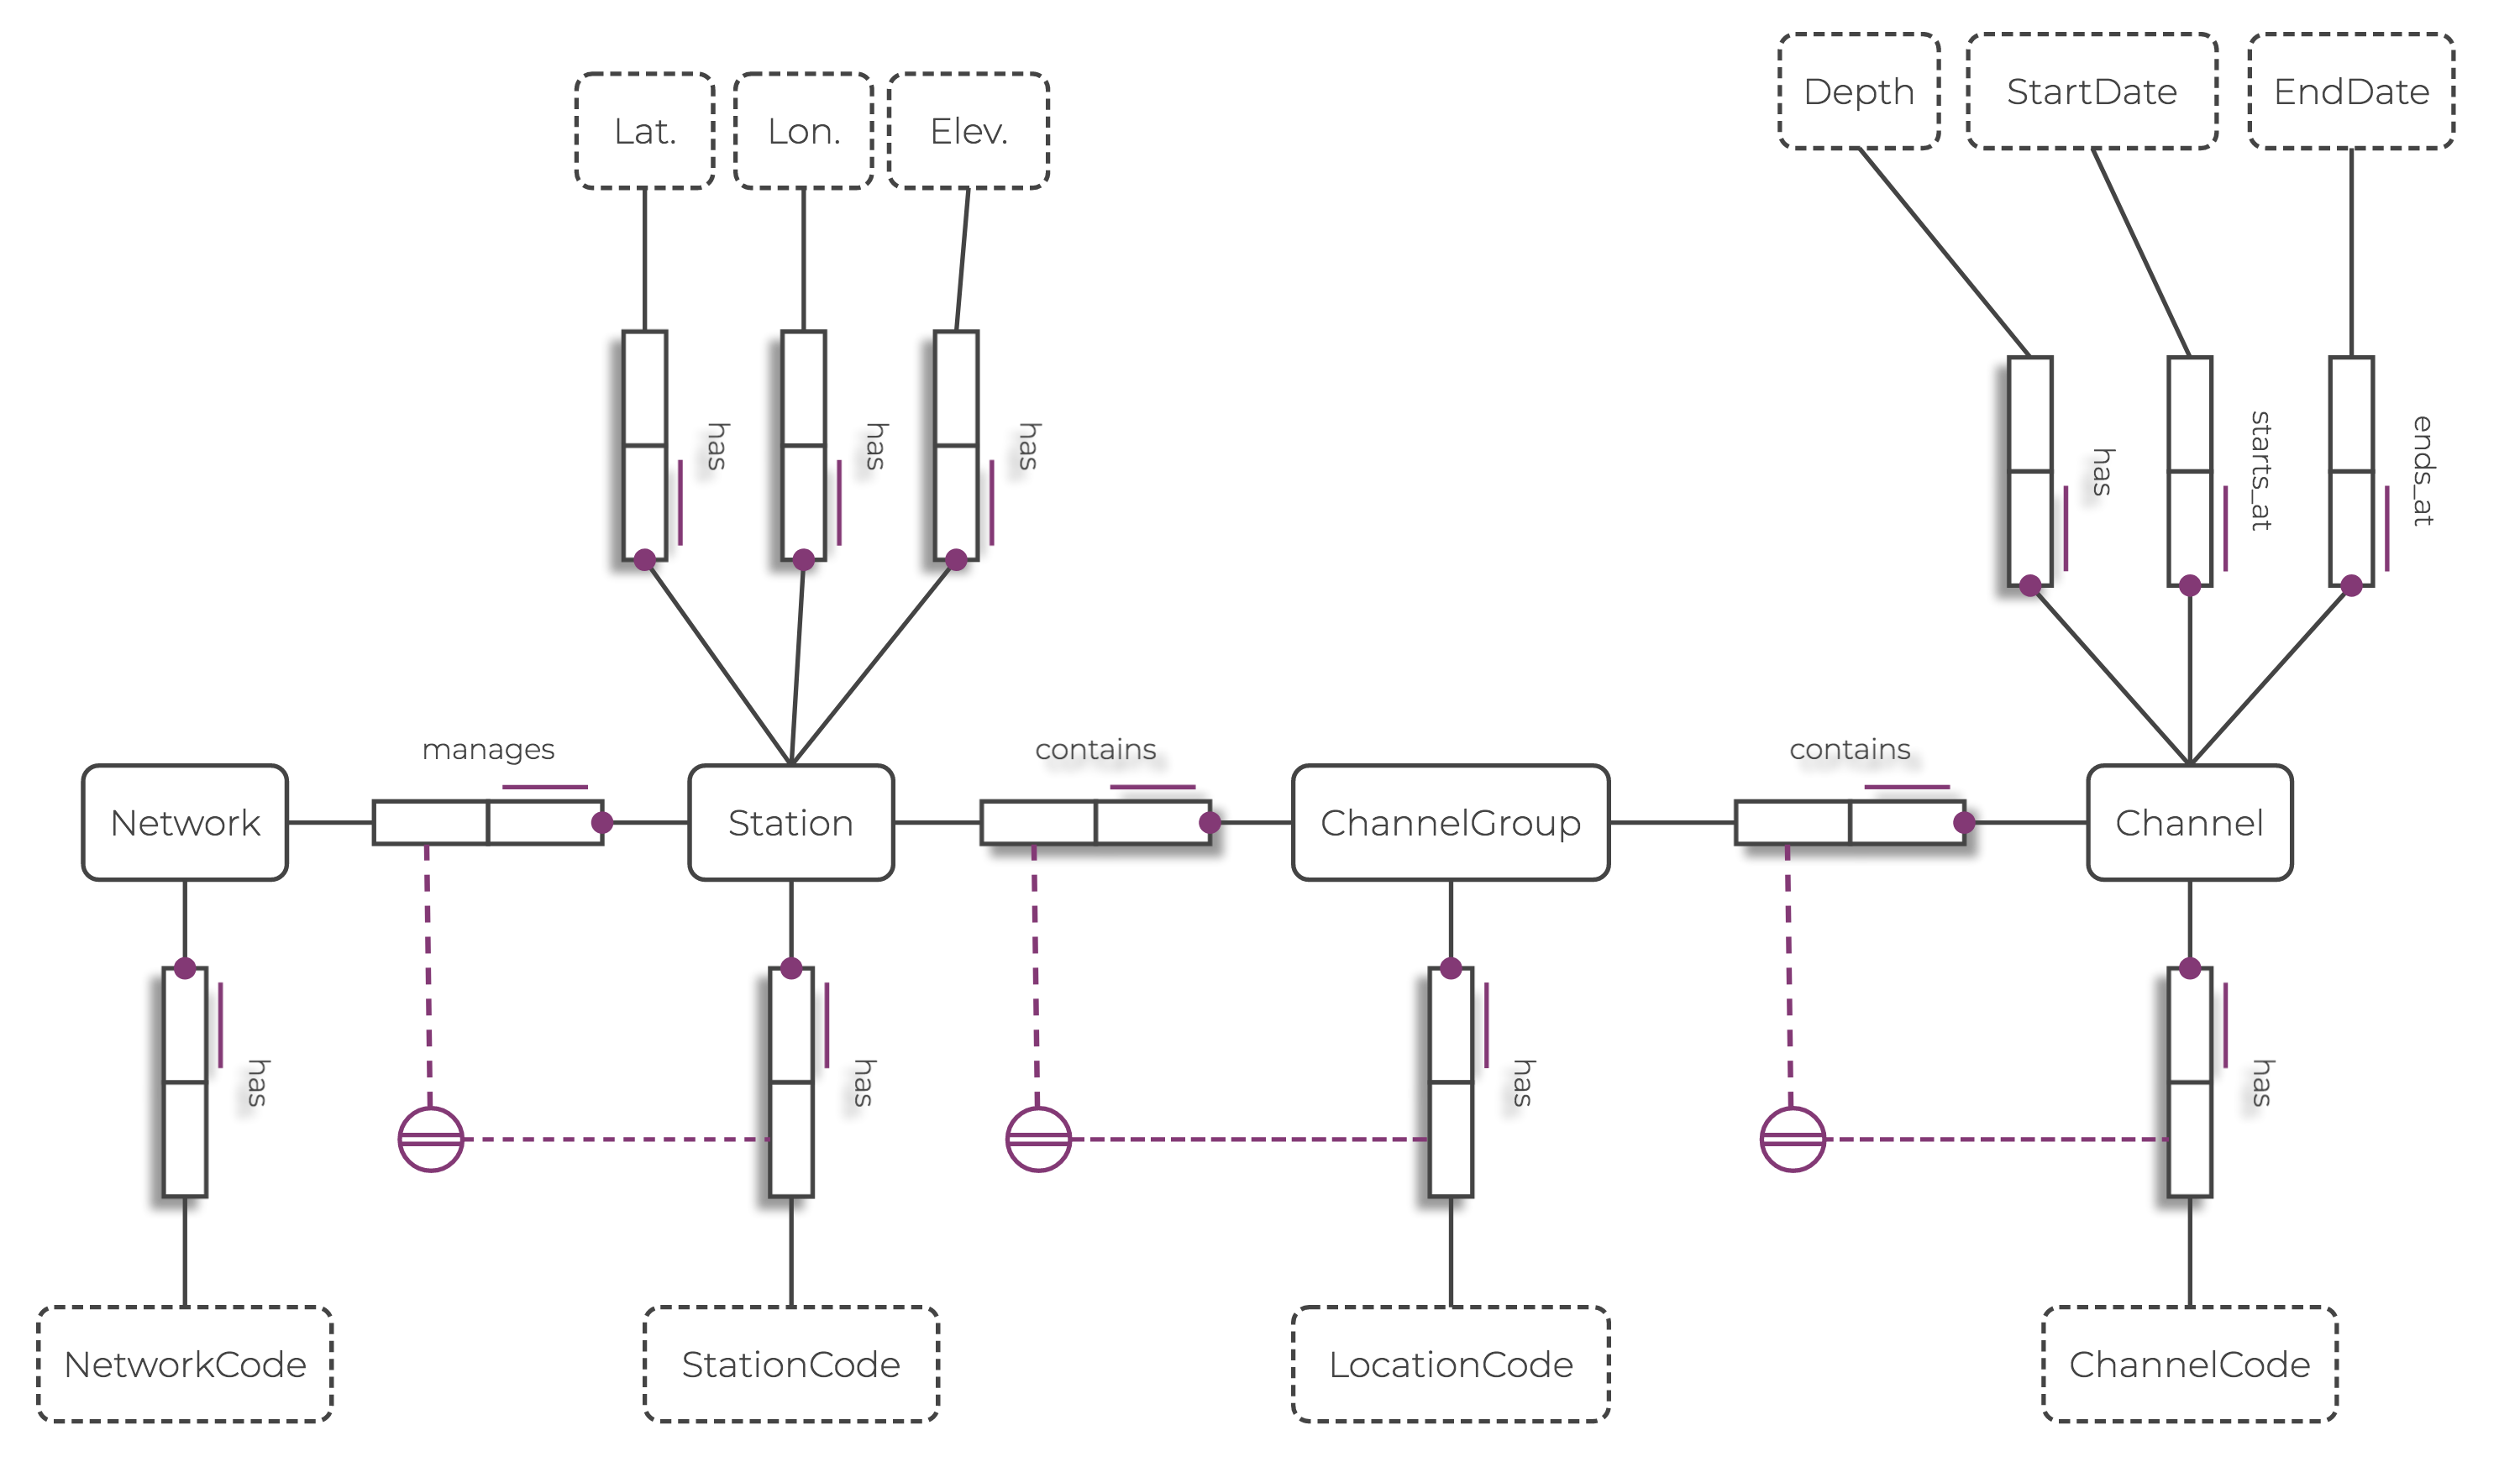
One added complexity of the data is that the uniqueness of individual entities are governed by a prescribed set of rules. These rules state that:
Networks have unique names, or codes. Stations managed by the same network have unique codes. Different channel groups in the same station have unique location codes. Channels within the same channel group have unique codes.
These conditions can be translated into logic using Rel when constructing entities, and are validated using a built-in language feature: integrity constraints.
For example, the constraints on networks are written like this:
// Network manages Station
ic { seis:manages ⊆ (seis:Network, seis:Station) }

// For every Station, Network manages Station
ic { total(seis:Station, transpose[seis:manages]) }

// Network has NetworkCode
ic { seis:network_has_code ⊆ (seis:Network, seis:NetworkCode) }

// For every Network, Network has NetworkCode
ic { total(seis:Network, seis:network_has_code) }
As a result, the data can be modeled easily, with clear, readable instructions!
Earthquake Event Data
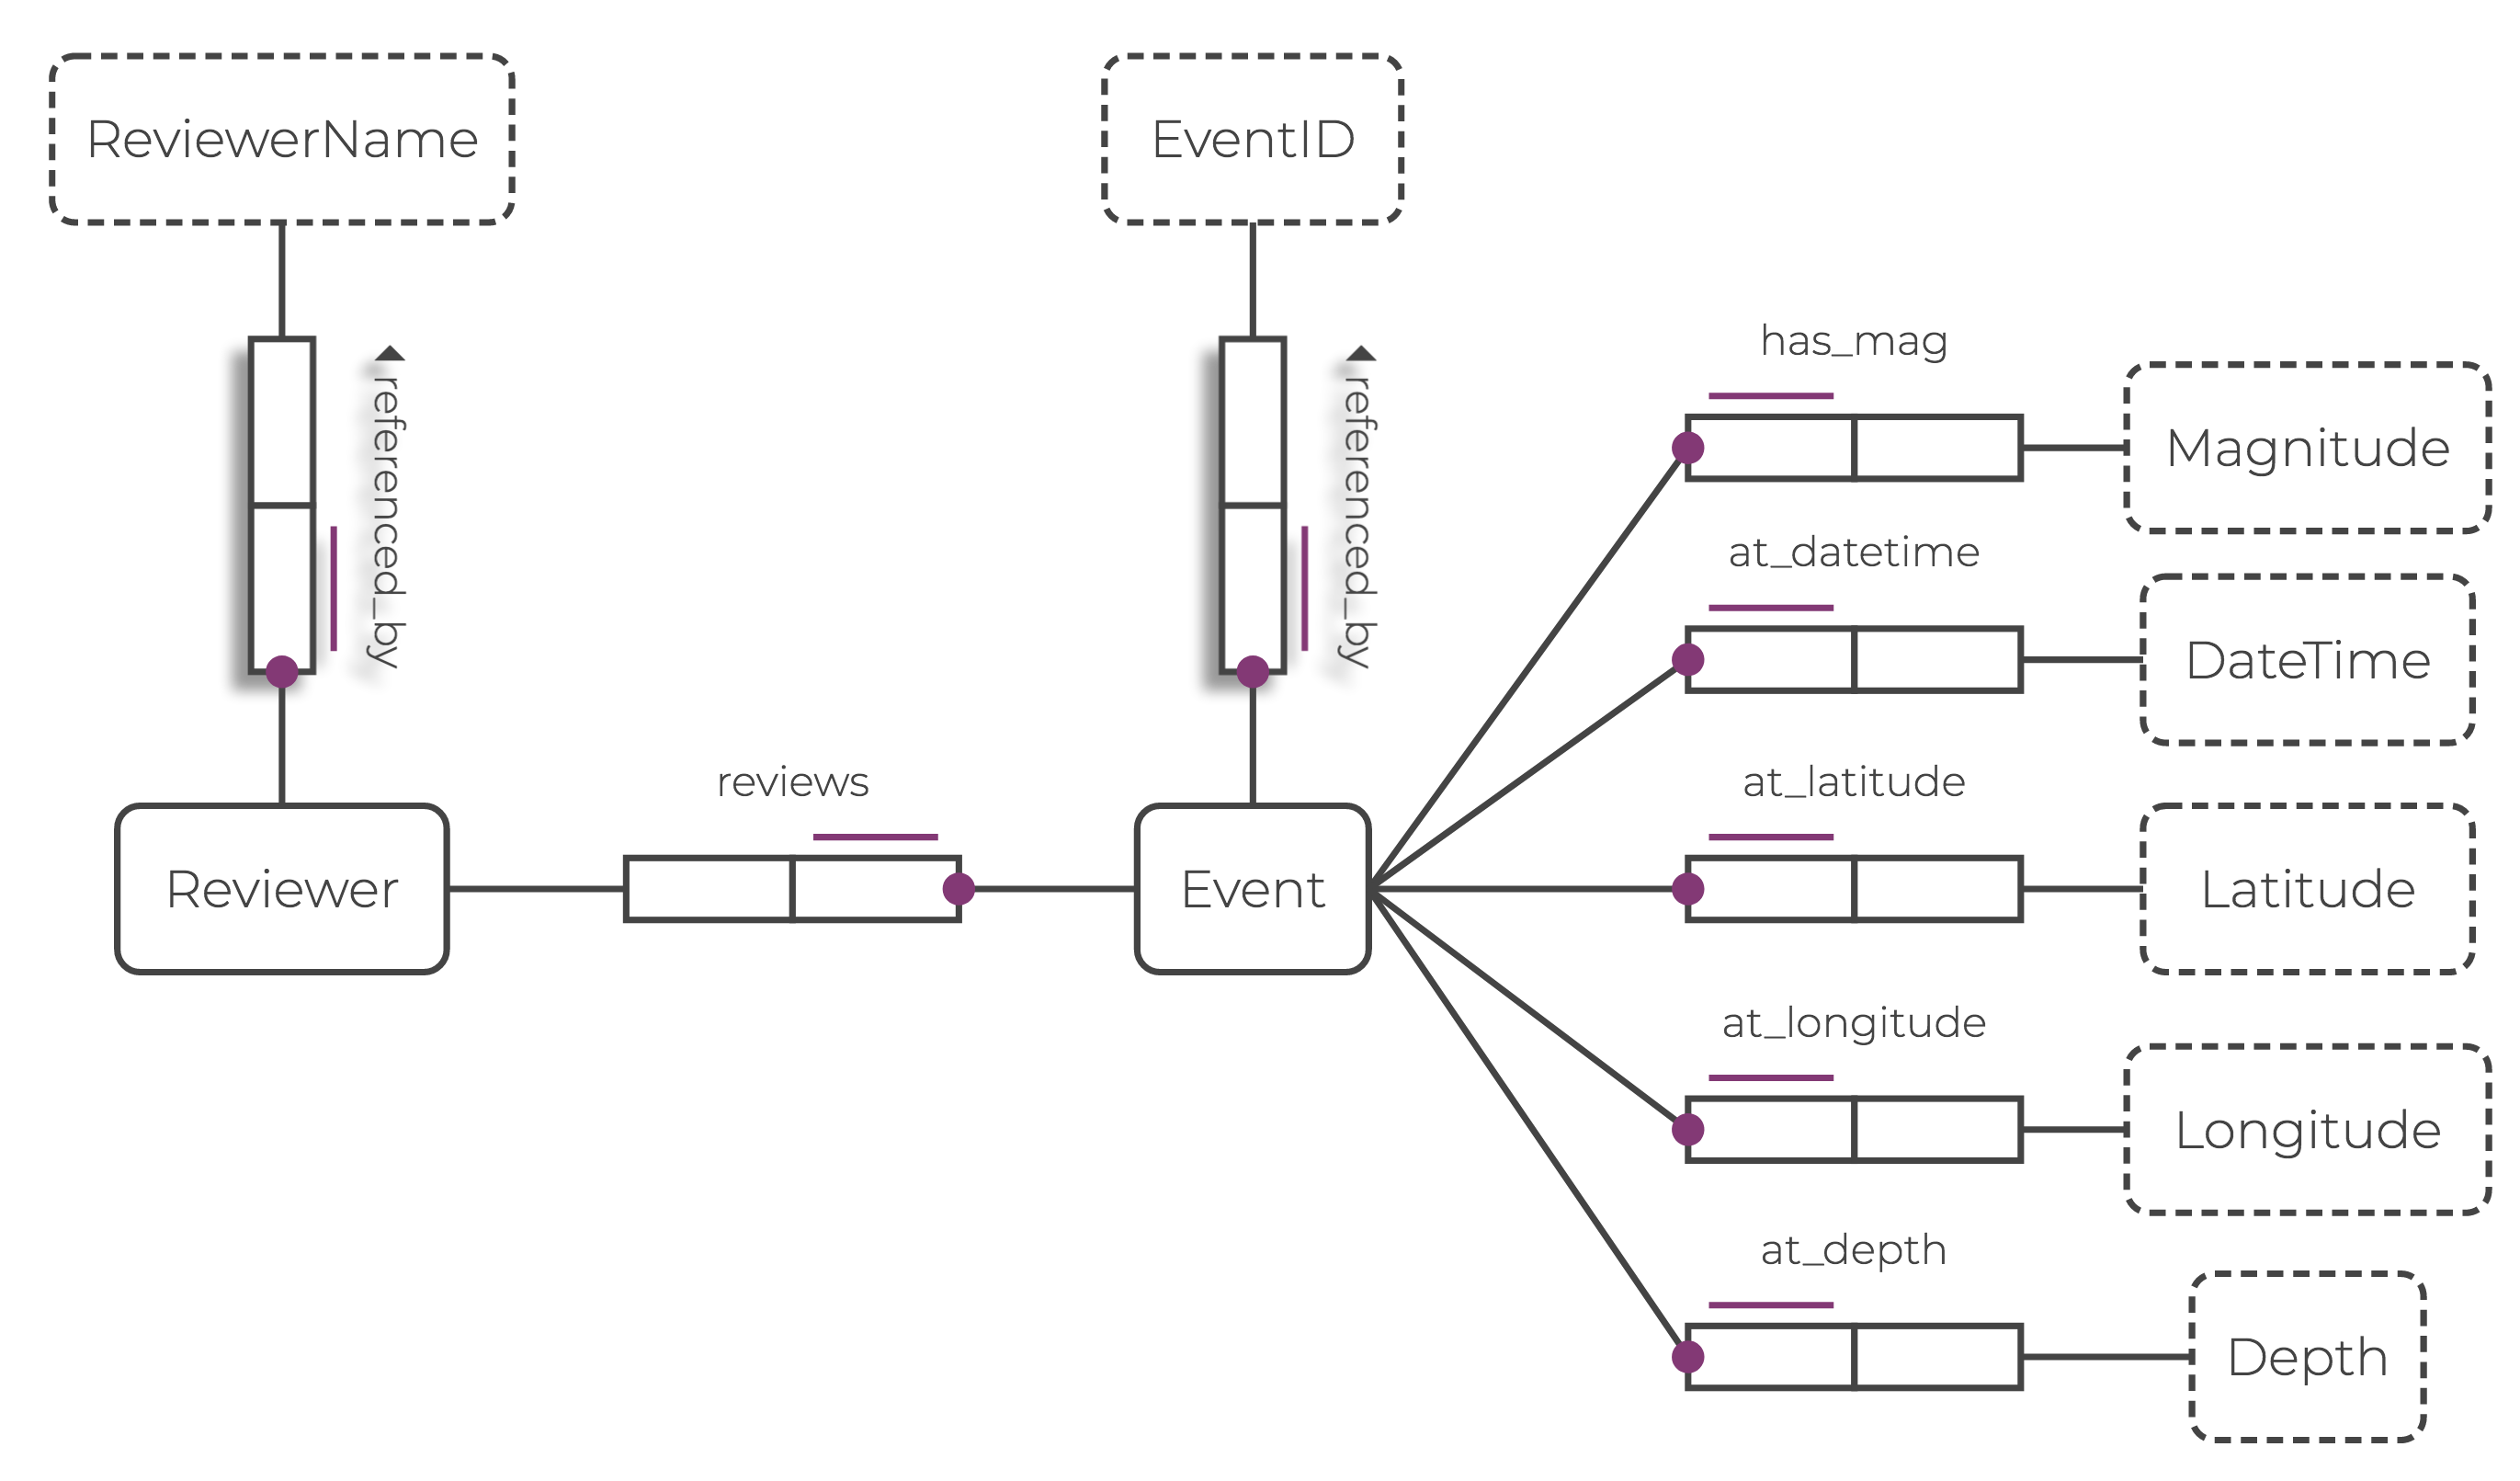
Earthquake data comes in the form of catalogs, which convey information about the event’s geographic position, time, and magnitude.
This data is usually presented in simple tabular forms, and although catalogs maintained by different institutions (or reviewers) usually have different schemas, they often contain equivalent information. As such, entities and attributes associated with this data can be modeled by an ORM diagram.
Again, Rel provides an easy way of parsing, importing, and forming entities, values, and relations.
Results and Querying
Now, the seismic data can be visualized directly in the RAI Console, using Vega-Lite plotting tools.
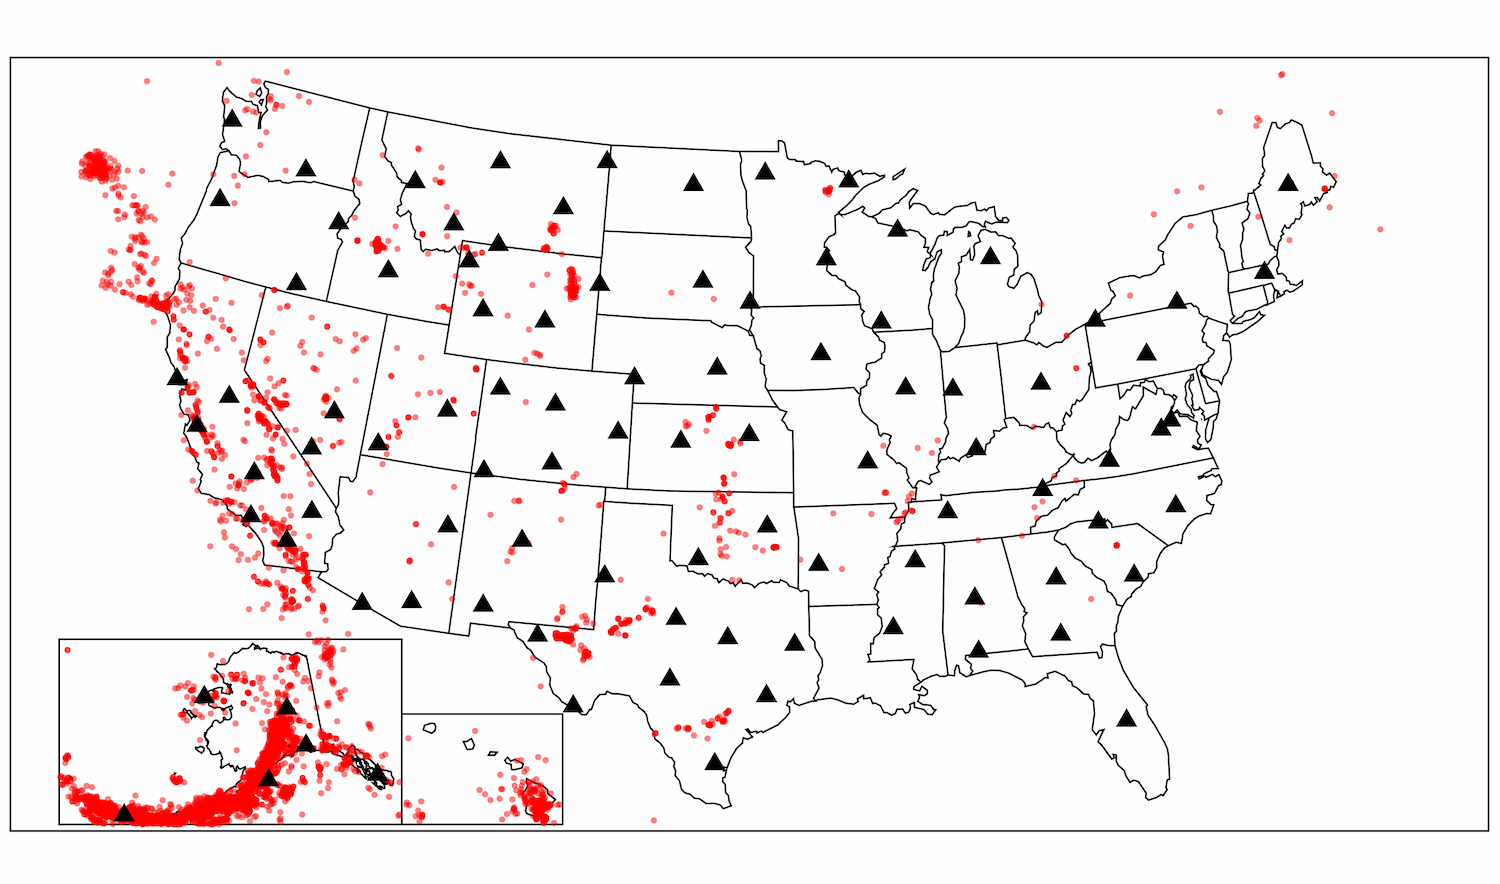
With the seismometer and earthquake data imported into the Relational Knowledge Graph System (RKGS), complex queries can be written in Rel.
For example, you can filter by the magnitude of the earthquake:
def magnitude_query[value_min,value_max](event) =
	seismic_sources:has_magnitude(event, magnitude) and
	(value_min < magnitude) and (magnitude < value_max)
	from magnitude

// E.g.,
def output = magnitude_query[5.5,6.2]
Or, you could filter geographically:
def latlon_query[lat_min,lat_max,lon_min,lon_max](event) =
	seismic_sources:at_latitude(event, lat) and
	seismic_sources:at_longitude(event, lon) and
	(lat_min < lat) and (lat < lat_max) and
	(lon_min < lon) and (lon < lon_max)
	from lat, lon

// E.g.,
def output = latlon_query[30,50,-90,-70]
Other attributes of the earthquake can be recalled, queried here by an event’s catalog ID:
def my_event_id = ^EventID["se60324281"]

def all_attributes(attribute, value) =
	seismic_sources:event_has_id(event, my_event_id) and
	seismic_sources(attribute, event, value)
	from event, my_event_id

def output = all_attributes
This query returns the following output:
Attribute | Value |
:at_longitude | -81.0865 |
:has_magnitude | 5.1 |
:at_latitude | 36.4743333 |
:at_datetime | 2020-08-09T12:07:37.650Z |
:event_has_id | se60324281 |
:at_depth | 4.14 |
Now with the date-time of the earthquake, you can find the seismometers that were operationally active and recorded that event.
@inline
def in_timerange[datetime,date_start,date_end] =
	(date_start < datetime) and (datetime < date_end)

def time_query[query_time](channel) =
	seis:starts_at(channel, operational_start) and
	seis:ends_at(channel, operational_end) and
	in_timerange[query_time,operational_start,operational_end]
	from operational_start, operational_end


def output = count[
	time_query[all_attributes:at_datetime]
]
This identifies and counts the seismometers that recorded valuable ground motion data, and allows for further scientific inquiry. Eventually, this information could be used quantitatively in hazard assessments, and inform future policy decisions.
Using Rel and the RKGS
Rel and the RKGS provide an excellent tool for investigating and analyzing seismic data.
This project illustrates an example of working with data that is distributed geographically and temporally. Rel was able to load, process, and query datasets of up to 500 000 seismic events, and many thousands of seismometers, in short lengths of time.
The RKGS also allowed for the integration of multiple data sources into a single, robust framework. Integrity constraints written in Rel enabled the application of the domain-specific logic for entity uniqueness.
Finally, Rel provided a flexible querying language for exploring the data. Complex and creative queries were possible, without having to worry about the underlying implementation.
Overall, Rel could be a useful tool for seismologists in industry and research. This work will be presented at the American Geophysical Union Fall Meeting this December. Come and stop by if you want to learn more!